Apr: Performance & Optimization!

Performance & Optimization!

Welcome to our roundup of the latest updates from the last month!
Scripting Improvements
Here's the Scripting Improvements of this month!
AI Avoidance Method
Epic's RVO Video Example
This was a request from the community, we've added a new method to control the RVO (Reciprocal Velocity Obstacles) of Characters.
This is an AI system that works by doing extra calculations to determine the the velocity and direction of NPCs based on other NPCs (or RVO actors) around, making them to avoid colliding with each other while they are moving.
We had this enabled by default, but we exposed a way to disable it on demand, with a new method Pawn:SetAIAvoidanceSettings() to allow customizing this behavior.
Escape Key Override
Many of you requested a way to handle the Escape key better, especially for menu navigation. We've now made it possible to register the Escape key in scripts.
Input.Bind("Menu", InputEvent.Pressed, function()
	-- Example code of usage
	if (is_my_menu_open) then
		CloseCustomMenu()
		return false
	end
end)
If the player keeps holding ESC for a few time, the game menu will still open as usual, ensuring they are not locked inside your server.
DLSS 4 Full Integration
Recently we upgraded our DLSS Integration to the latest DLSS 4, which brings a lot of improvements to the existing technologies and a the new feature Multi Frame Generation (although only supported on the new RTX 50).
And to take the pack with, I've take the time to finish the DLSS integration into nanos world, as we were only supporting Super Resolution and Frame Generation (2x) settings before.
So we now have fully integrated:
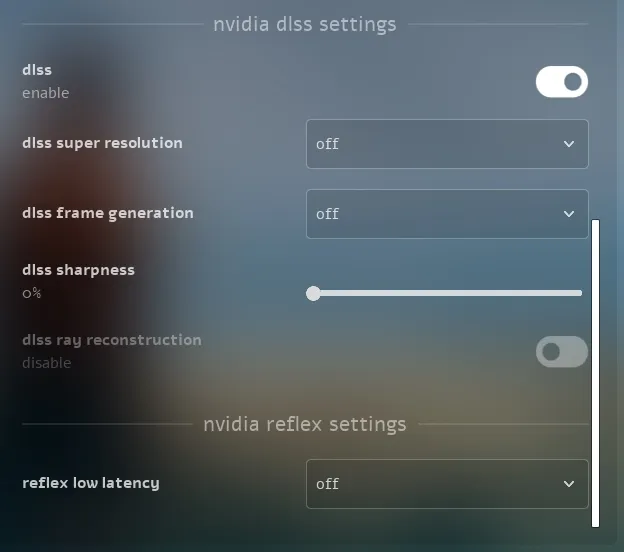
New DLSS & Reflex Settings
Super Resolution
All DLSS Super Resolution settings are now fully integrated into the UI. Enabling SR will automatically disable resolution scaling and anti-aliasing, as SR handles these internally.
You can see the difference in performance by comparing the Ultra Performance mode (recommended only for 8k resolution) and it turned Off:

Comparison DLSS Super Resolution (SR) Ultra Performance Mode
Frame Generation
We've properly integrated Frame Generation into the UI (requiring VSync OFF and Reflex ON). Multi Frame Generation is also supported—if you have an RTX 50, let us know how it works for you! 😅
You can see in the comparison, it almost doubles the frames presented (we display it in a separate line as it only doubles the presented frame - and not the game frame):
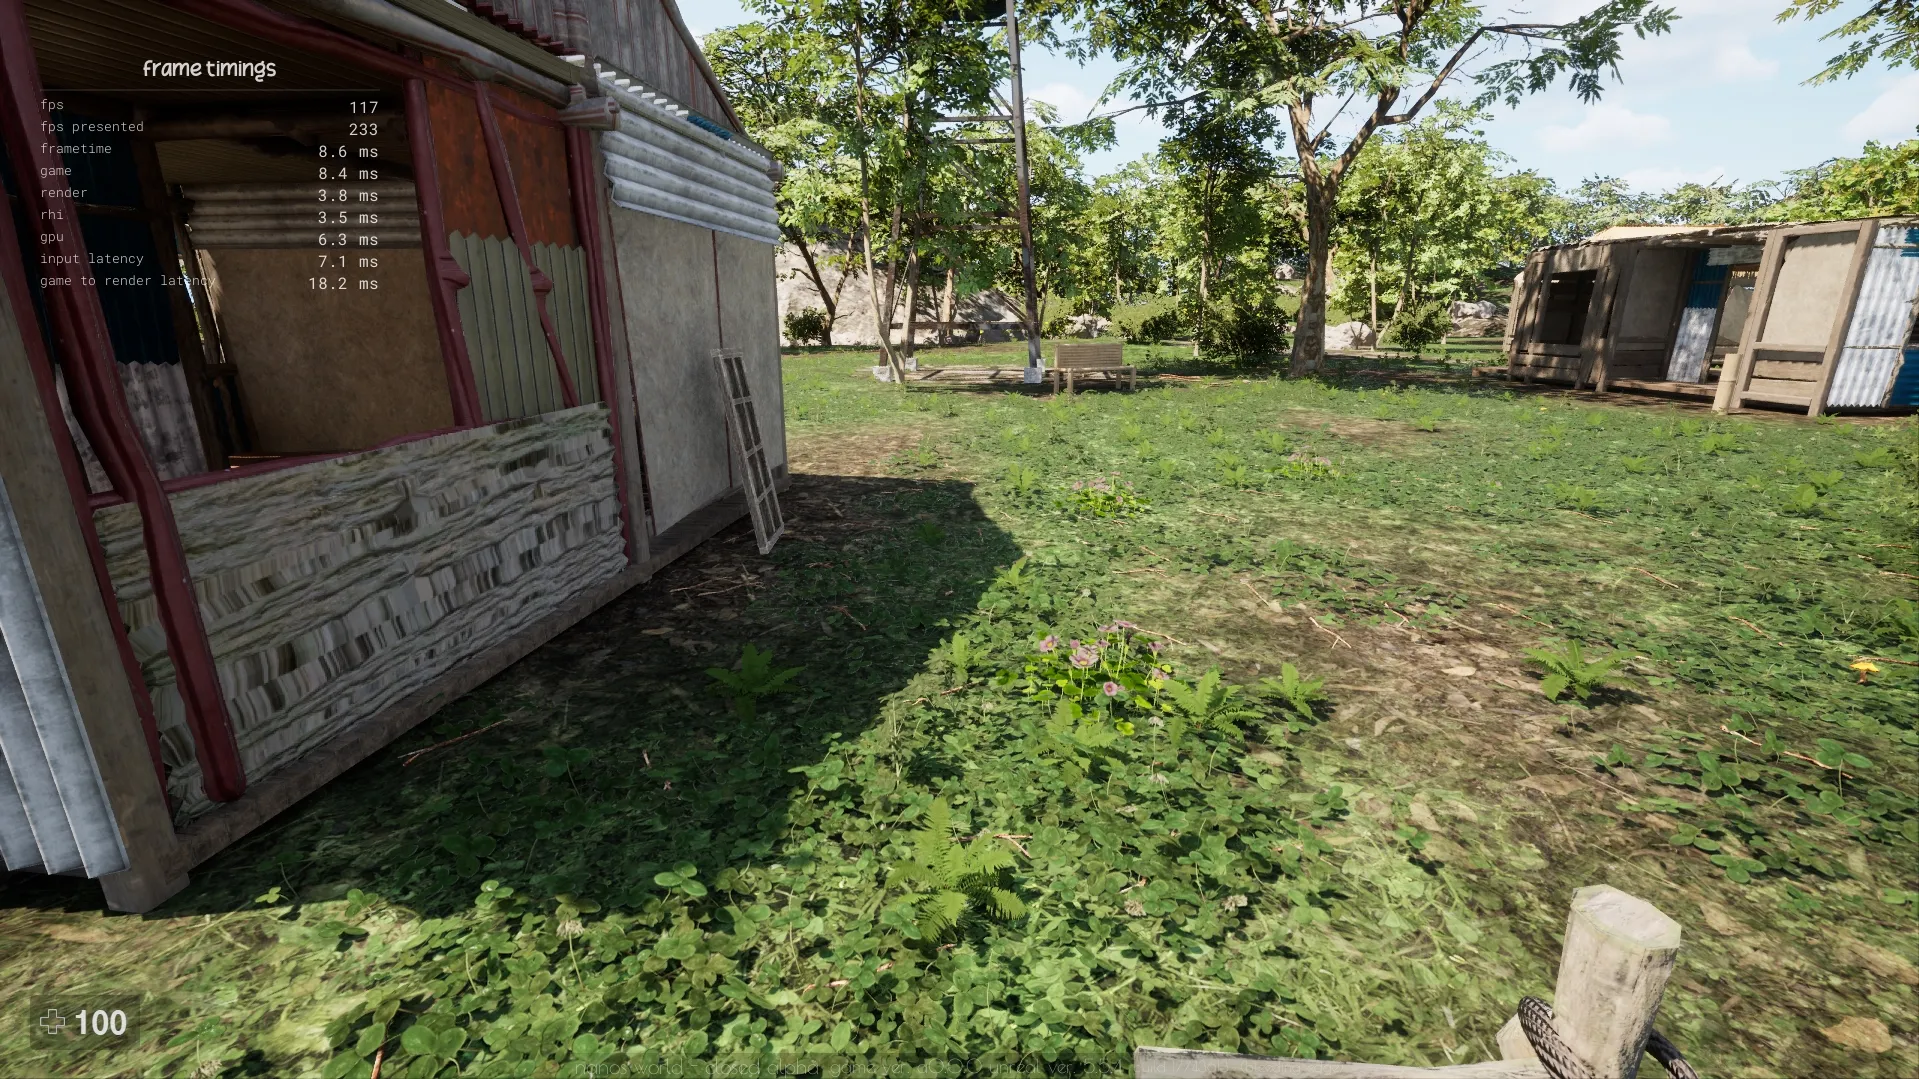
Comparison DLSS Frame Generation (2x)
Ray Reconstruction
This is a new integration that improves the image quality in scenes with complex lighting and shadows, you can see the shadow artifacts going away when having it enabled, note it has a small performance cost:

Comparison DLSS Ray Reconstruction (RR) + DLSS Ultra Performance
Sharpness
We also added a new slider for adjusting the DLSS sharpness, if desired.
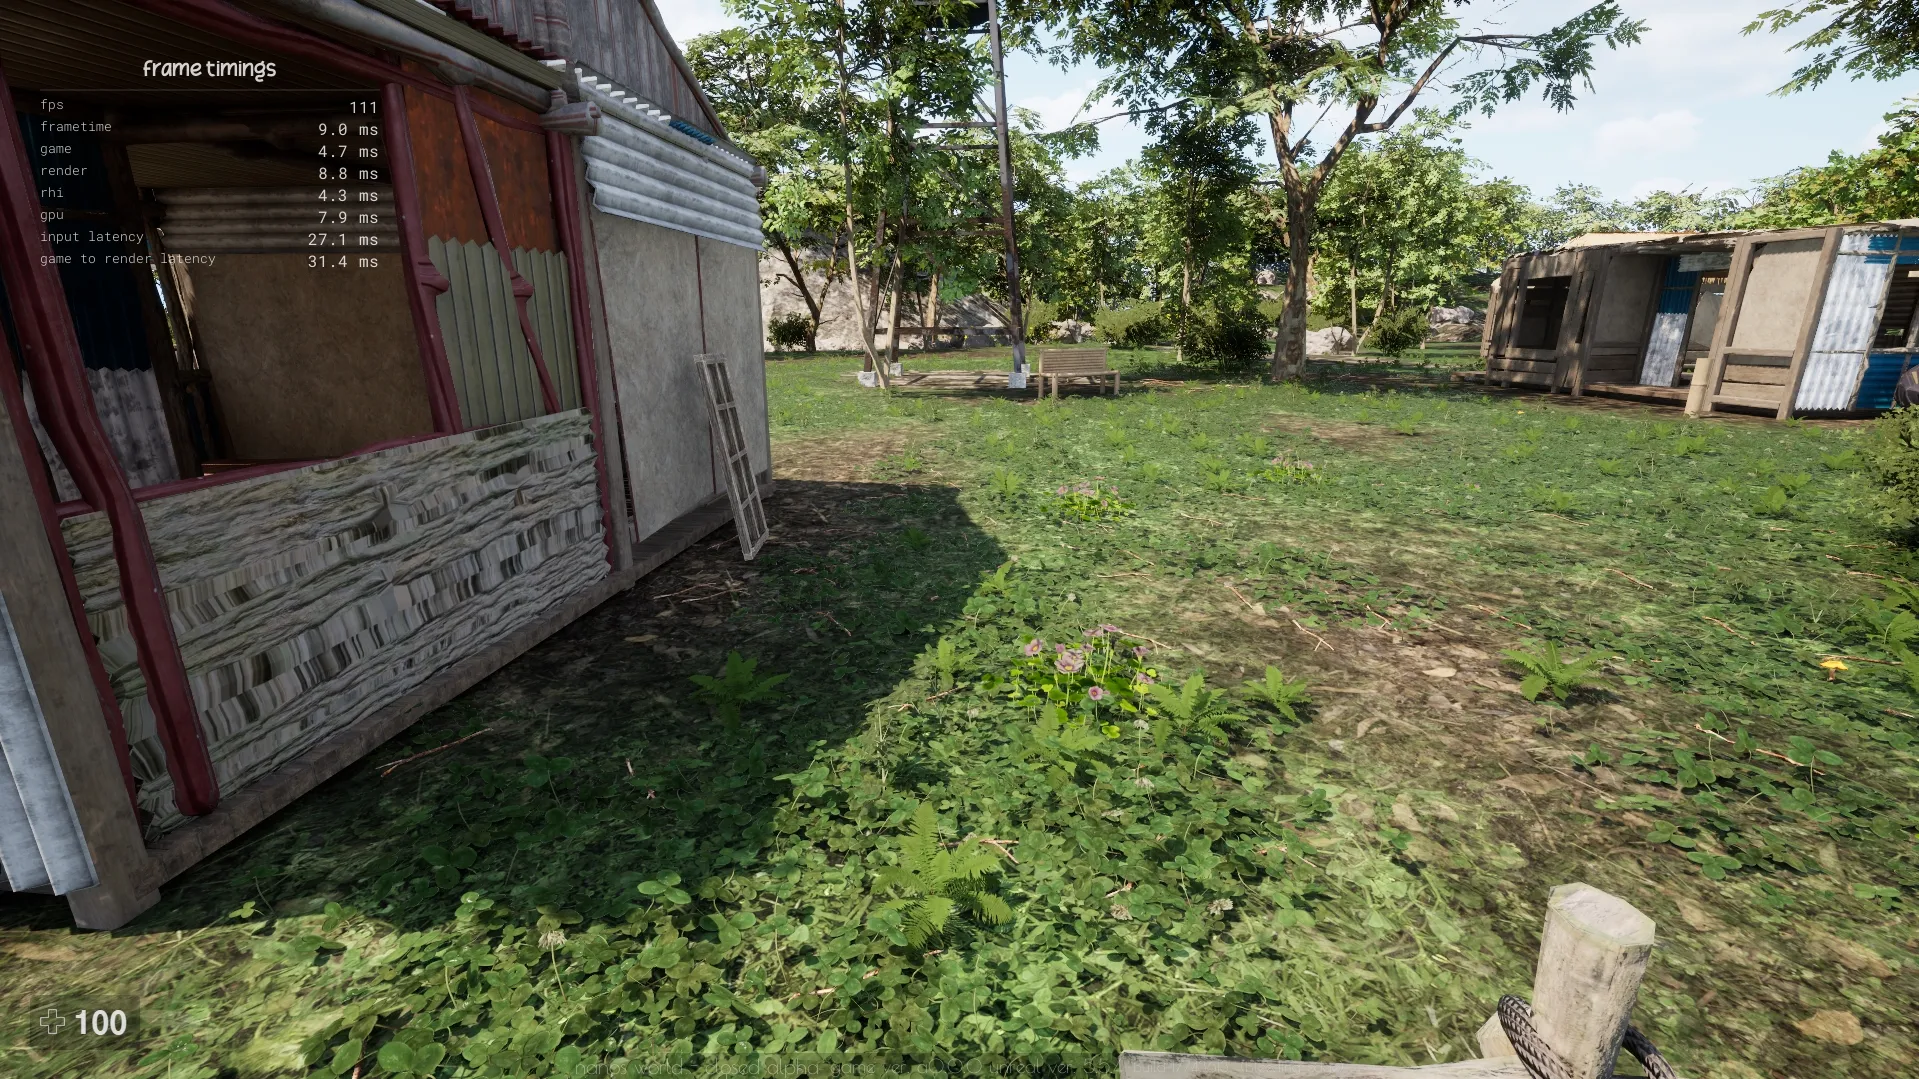
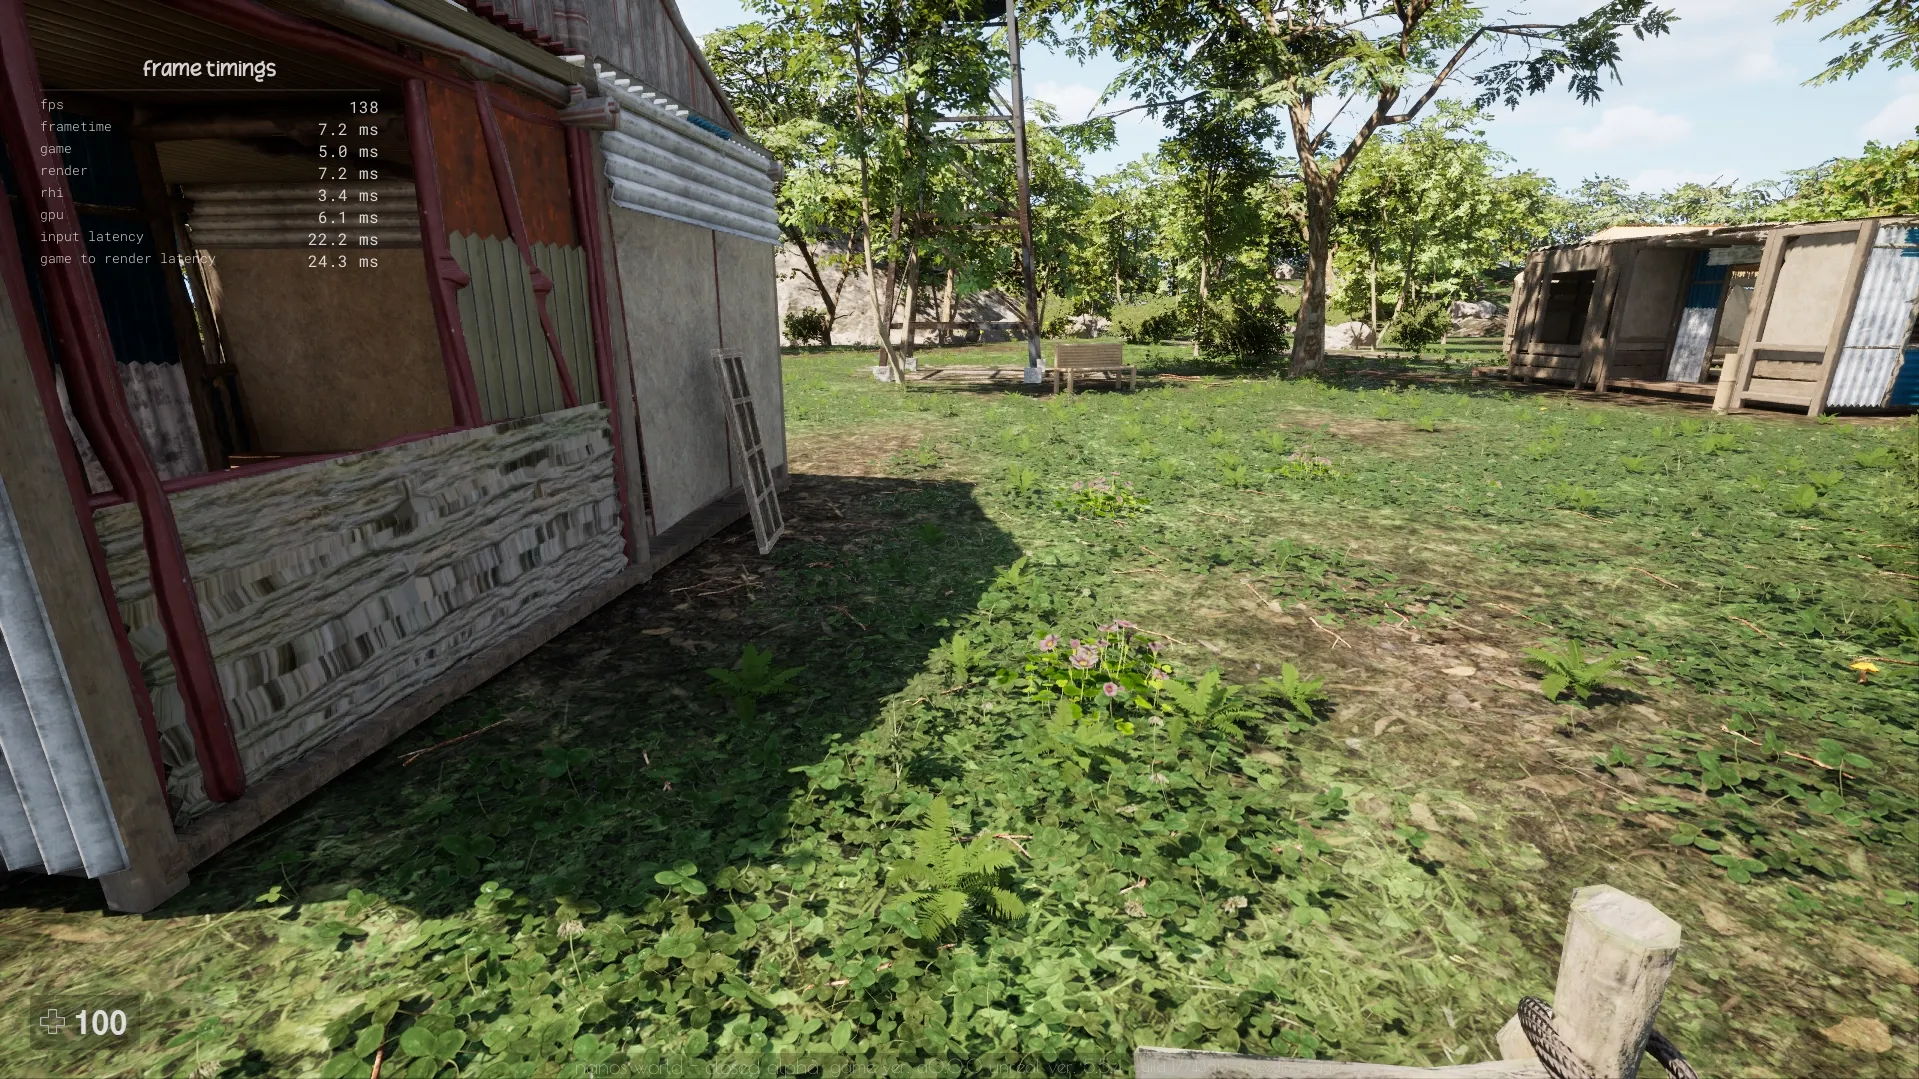
Reflex Low Latency
Reflex Low Latency reduces input lag, making gameplay feel smoother and more responsive, you can see the difference in the input lag:
Comparison Reflex Off vs On
Crashes & Sentry
As with any game in development, crashes happen, but we need to be aware of them to fix them. You've probably encountered the Unreal Crash Reporter screen before, but we've now integrated a new SDK to catch the crashes with the new Sentry for Unreal Plugin.
Sentry is a tool that logs game crashes, fatal errors and context information and sends it to our own server.
We already used Sentry on both client and server before, but now we are integrating it more natively in the client side, helping me to track and receive the game crashes and errors with more useful information.
With this new integration we are getting rid of that generic ugly Unreal Crash Reporter, and for now we have this new another ugly popup that will show up when a crash happen:

New Crash Popup displayed just after the game crashed
We are now able to get more rich and contextual information that helps even more tracking the real causes of crashes. Without needing that much keep asking for reproducible steps.
Profiling
Unreal has an awesome tool called Unreal Insights. It is a telemetry tool that capture and analyzes each frame of the game, telling us exactly the bottlenecks and which methods are bottlenecking.
I've started using it as I was finding nanos world was with some bottlenecks, and I could find a lot, which helped fixing several performance problems:
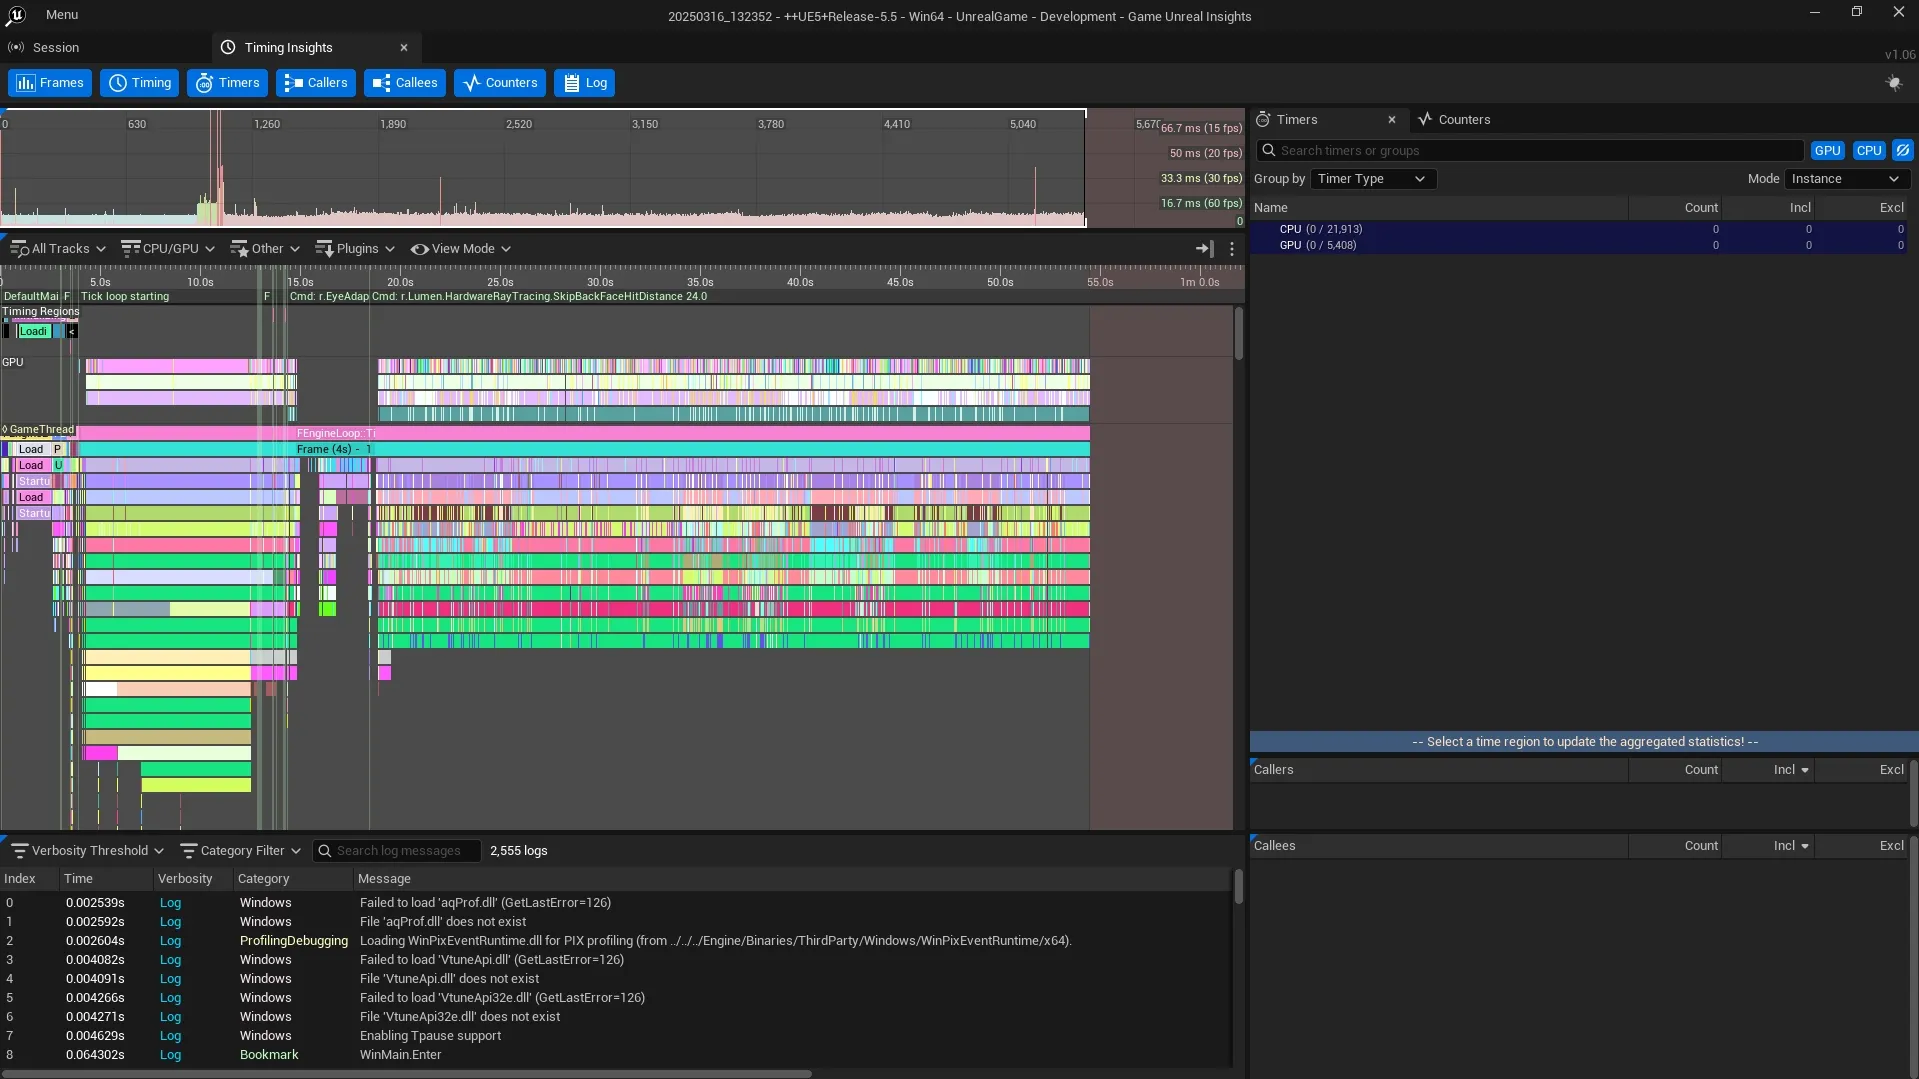
Unreal Insights Application dissecting a nanos world frame
Profiling Debug
I've improved the Profiling Debug section, now it displays the time per second an operation is spending, the amount of calls, the average time each call takes and the max time an operation took in the last second (peaks).
Also, I've hooked Unreal's timings to also display the Unreal Global Tick and Slate Tick times:
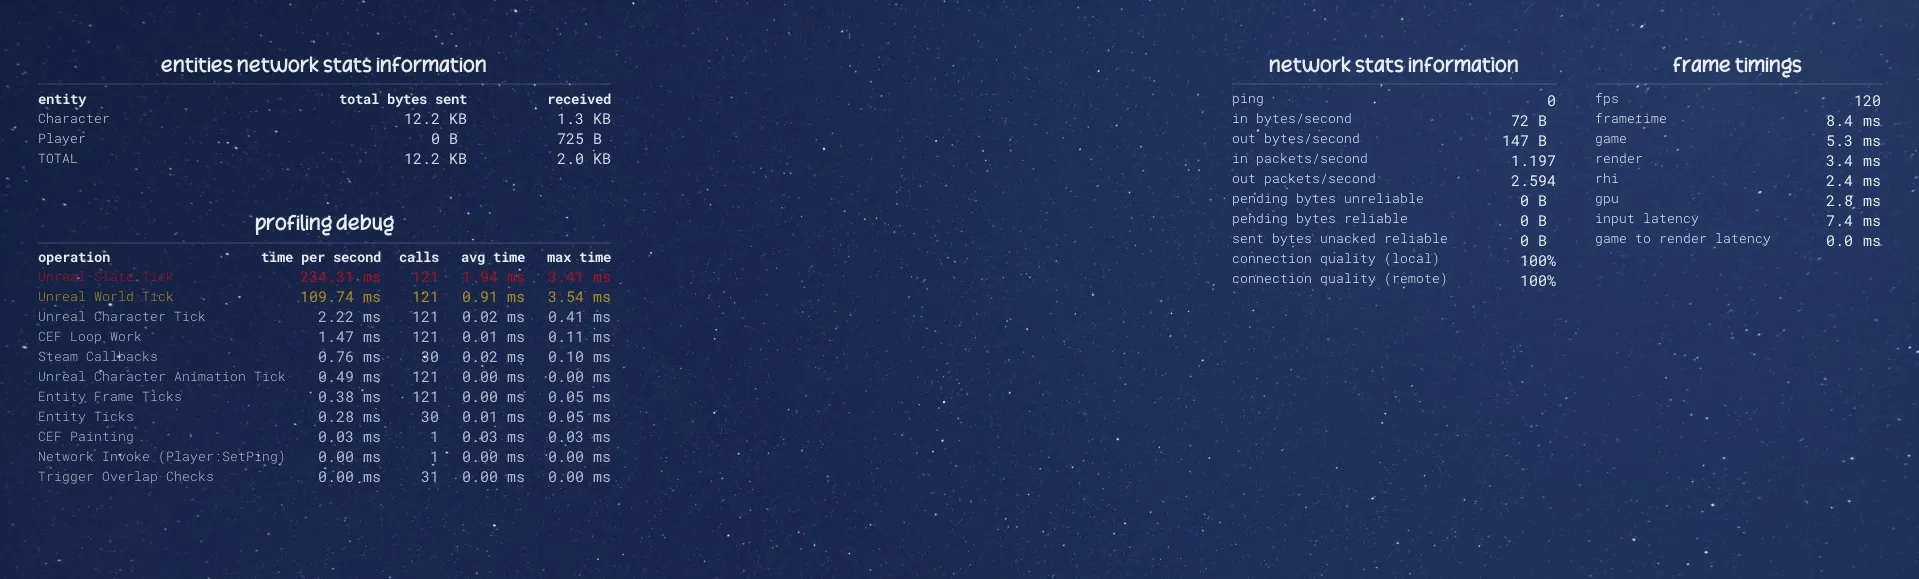
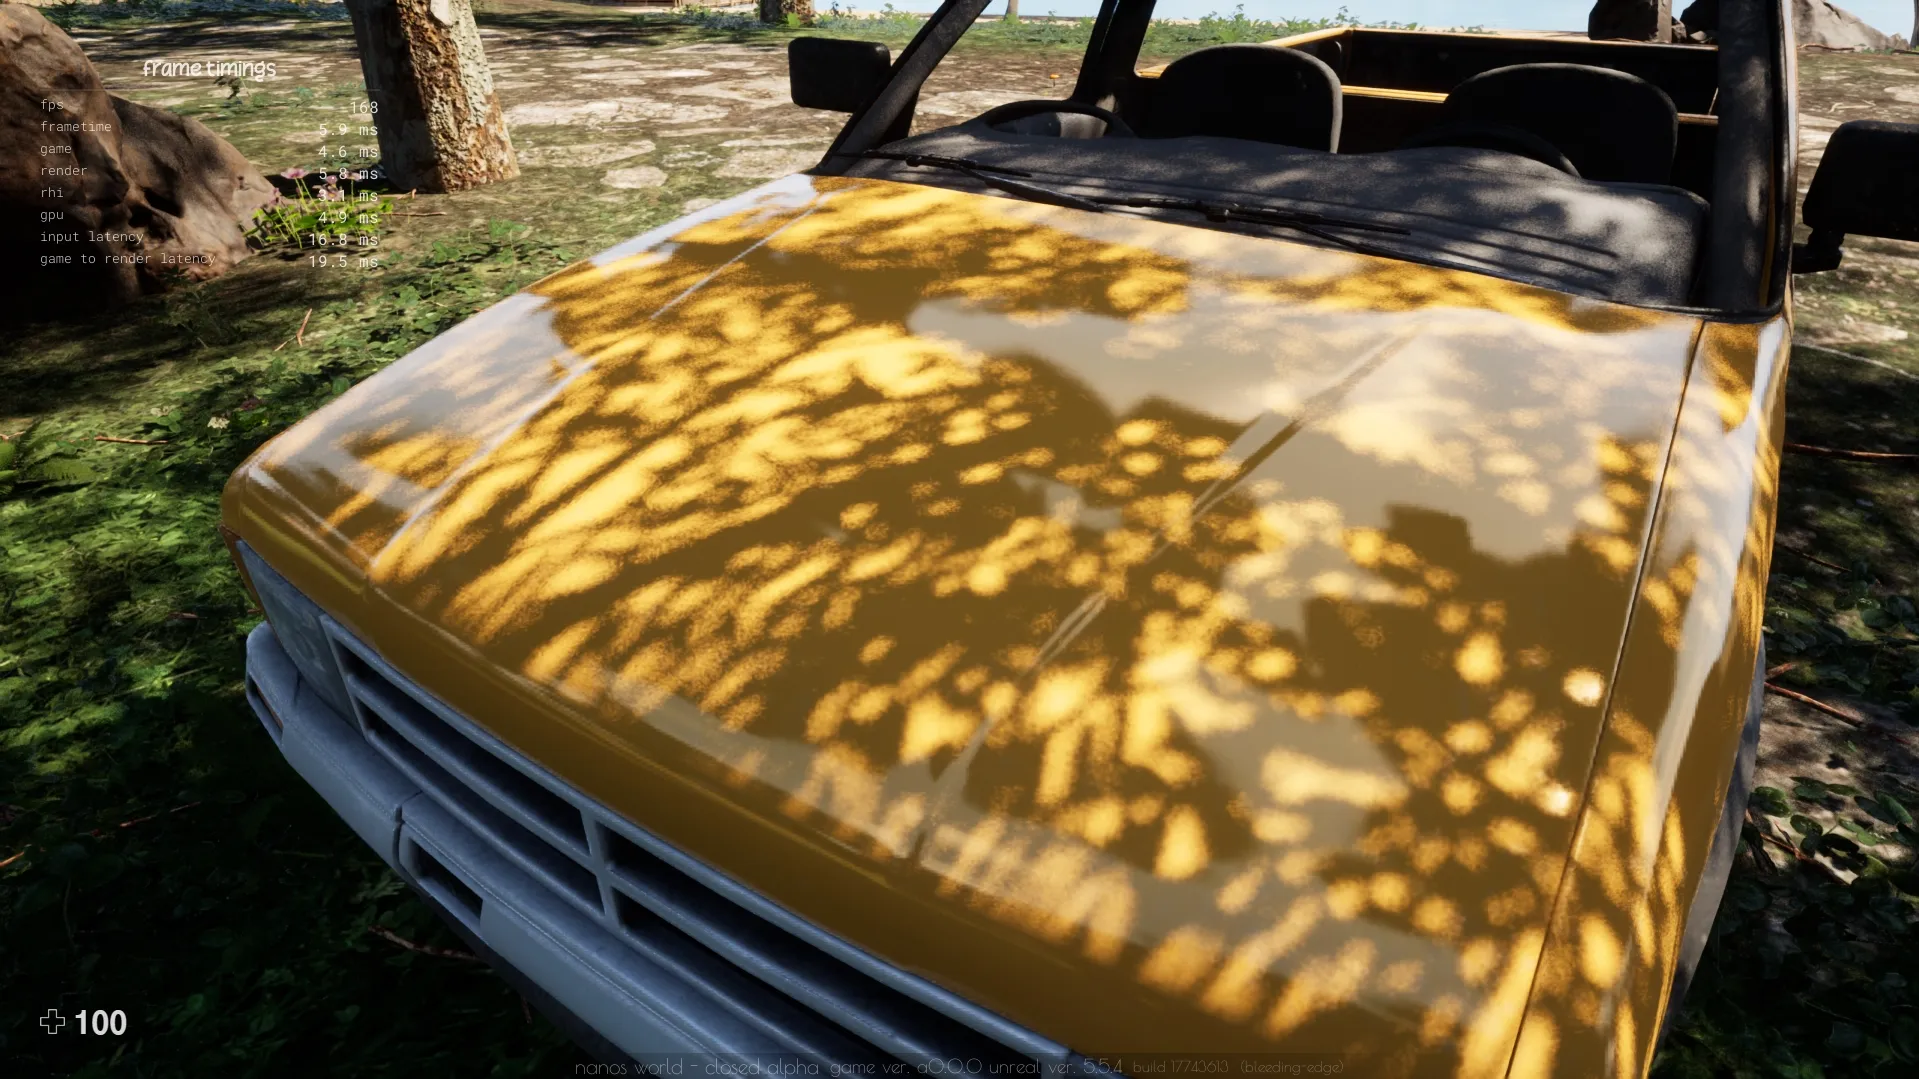
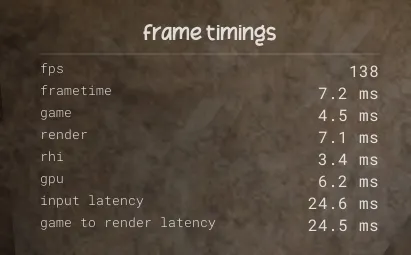
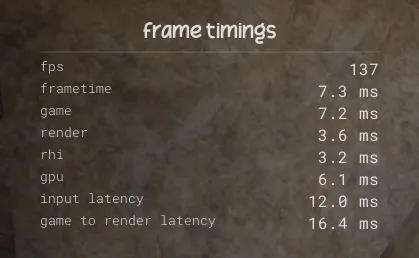
New "frame timings" section displaying frame, game, render, rhi and input times
Also "profiling" section with new timing columns and new Unreal entries (World Tick and Slate Tick)
FPS Timings
I've integrated our own pane for displaying FPS and timings, replacing the Unreal's green overlay. This can be activated in a new dropdown in Debug Settings:

New Frame Times Settings
As you could see in Profiling Debug above, now you can see all the timings and threads that run in the game:
- Game: Time the main execution thread (Unreal Ticks, Timers, Networking, Lua Code, UI, etc) spent to run the frame.
- Render: Time the render thread spent preparing commands for RHI thread
- RHI: (Render Hardware Interface) Time the DX11 or DX12 thread spent sending operations to GPU.
- GPU: Time GPU spent rendering the frame.
- Input times: Delay between pressing an input and the game responding to it.
The game thread will always wait for the other threads to finish (waiting to catch up to either one or two frames behind from the render thread), so you can identify which thread your game-mode is bottlenecking by analyzing which timing is the one equal to the frame time.
You can learn more about those timings and Unreal Threads in the Threading Overview Epic's documentation page.
Game Performance++
Thanks to Unreal Insights and the new profiling timings, I've managed to identify and fix several performance issues we had:
Console Freeze Fix
The console no longer stutters when opening! We had cases where it froze the game for several seconds, but that's now fixed!

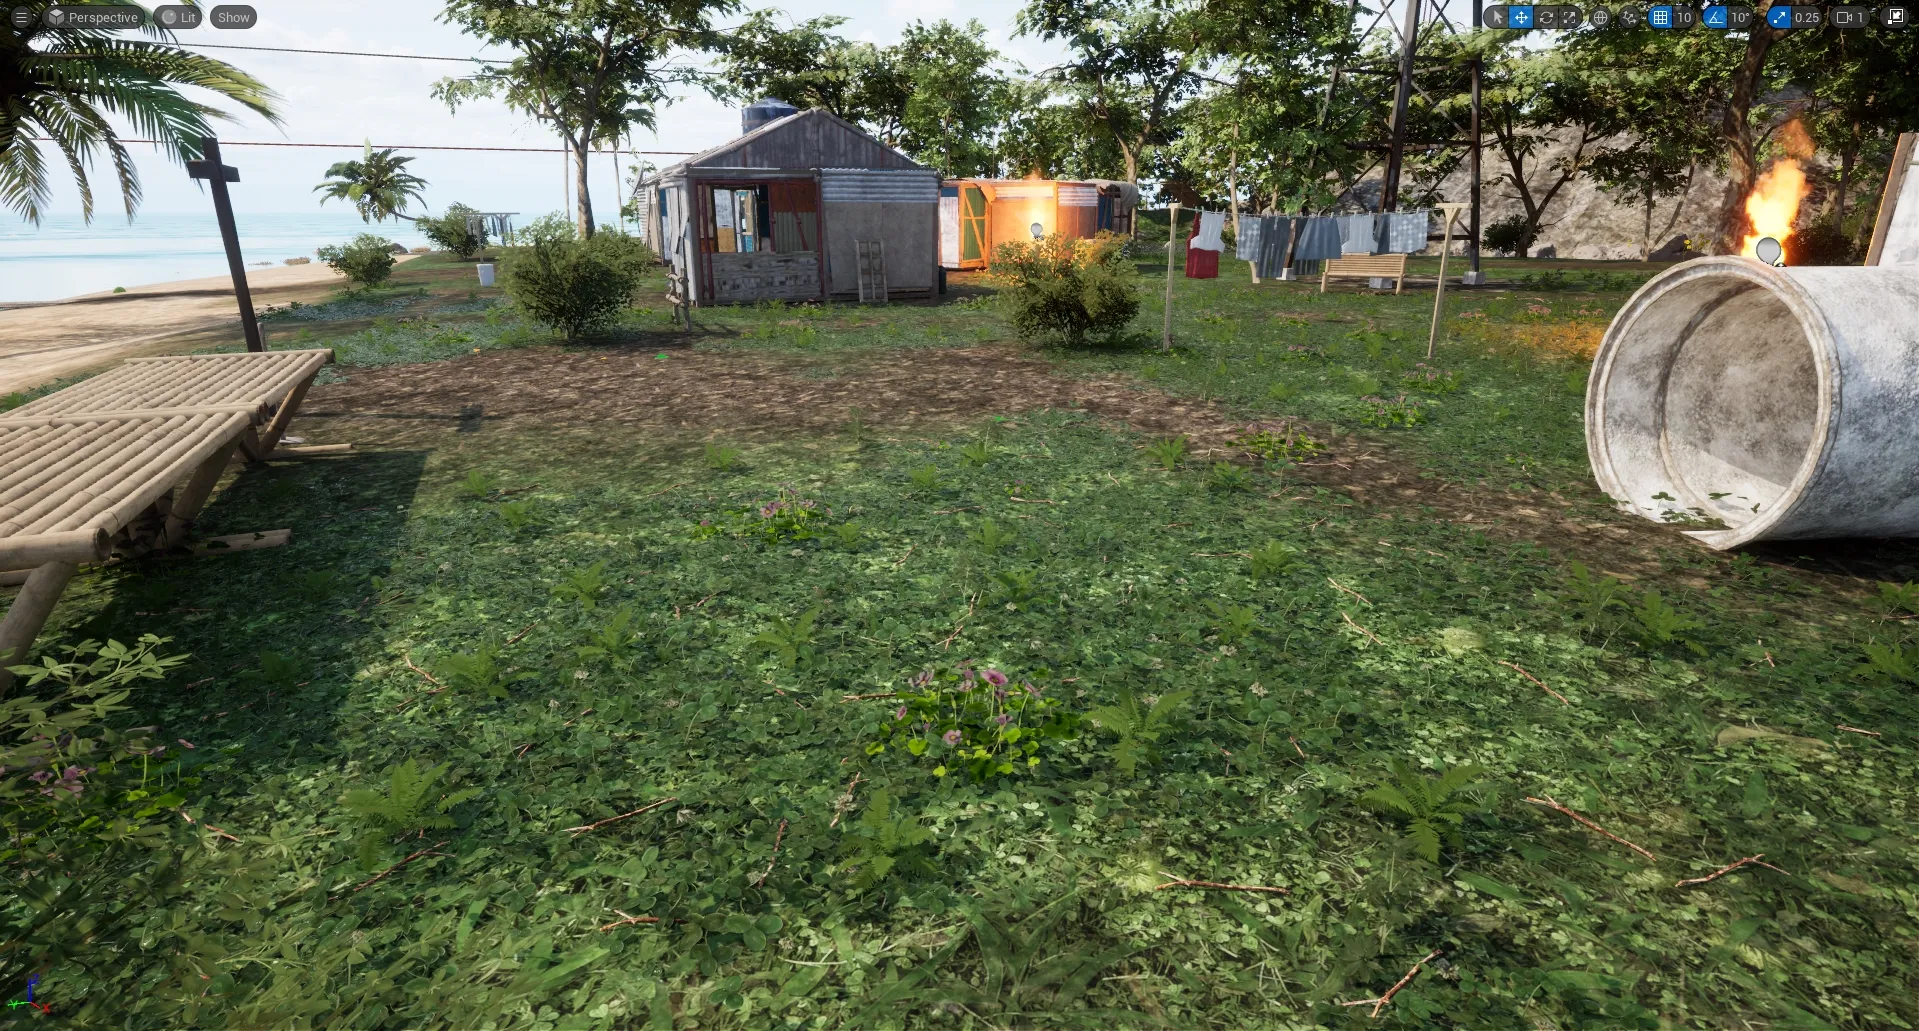
Testing Map NavMesh
Since some time ago, our default-testing-map (which is already aged 😅), started to underperforming very badly. The FPS wasn't great and we could clearly see that the GPU wasn't being used at it's most (we had a main thread (CPU) bottleneck).
By analyzing the frame, I could see that the culprit was it's NavMesh being recalculated every frame (as we use Dynamic Nav Mesh generation), and it was spending HUGE time on game thread.
Then I ended up figuring out that the reason was some objects in the map causing that:
That Static Boat
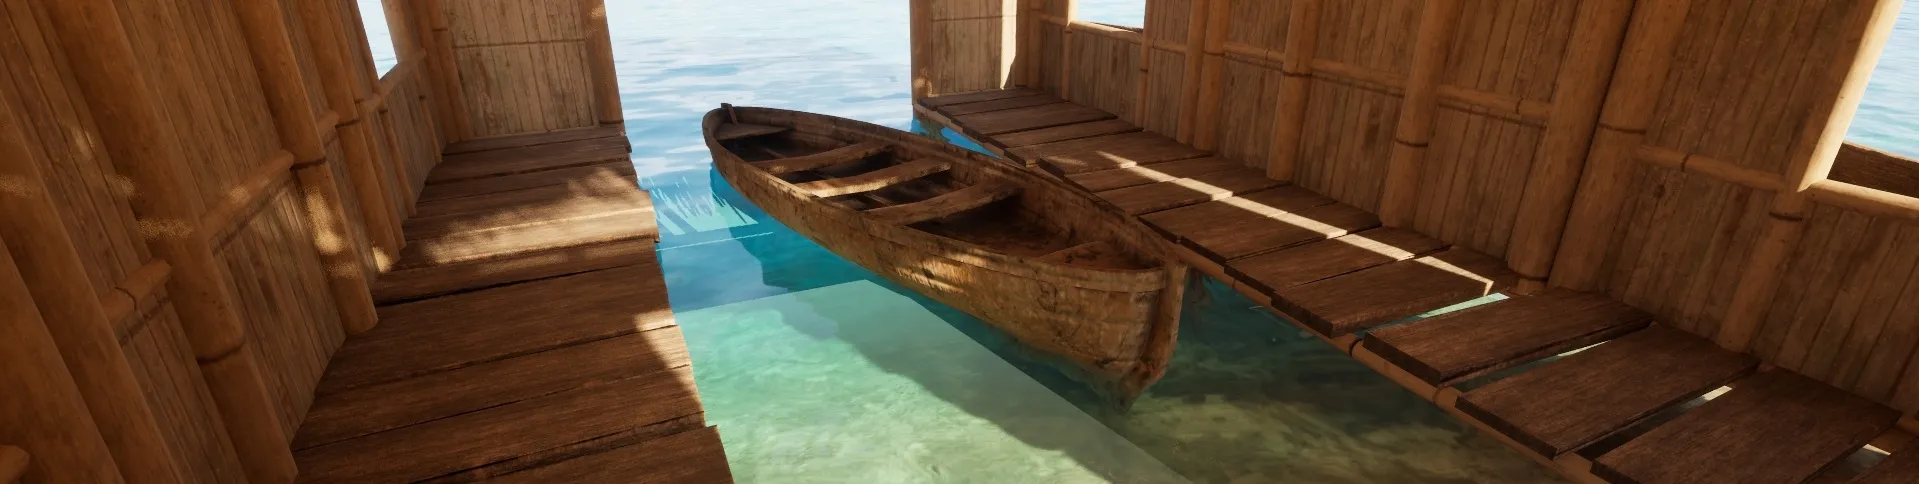
Static Boat in the Cabin of Testing Map
This Boat is just an Actor in the map with buoyancy enabled, but it had the "Can Even Affect Navigation" setting enabled, and it was causing all the NavMesh around it being recalculated every frame.
Props
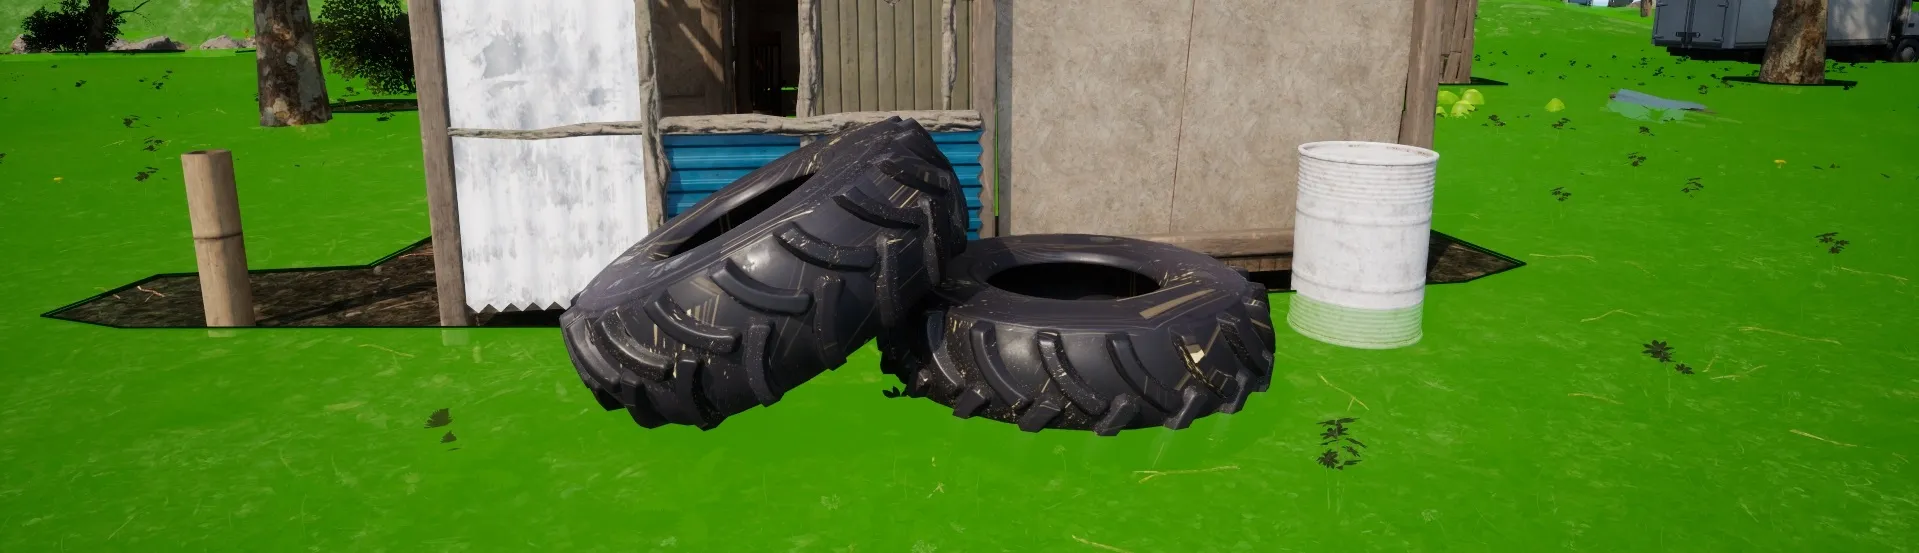
Props not affecting Nav Mesh anymore
Another escalating entity that was also affecting the NavMesh was the Prop. It also had the Affect Navigation toggle enabled, and the performance was being drastically drained when we had a bunch of Props in the map.
Of course it could cause some drawbacks, like NPCs walking through Props and kicking them away, but the performance gain is immensurable. And also I'm studying the possibility to add a new method to programmatically enable/disable Props from affecting the Nav Mesh, so if you really need it, you can enable per Prop.
This fix is absolutely a huge improvement, it's very noticeable how smoother is playing on Testing Map now.
Those improvements will not only improve the testing-map, but also all other maps in the game, including yours!
Testing Map Shadows
Another issue we were having was with the lighting/shadows of the testing map, we had Dynamic Shadows enabled for all grass meshes, which is usually a bad decision as it consumes a lot of GPU performance.
So I changed all grass shadows to use the Contact Shadows method, which is way efficient, and the visual results were quite very similar:
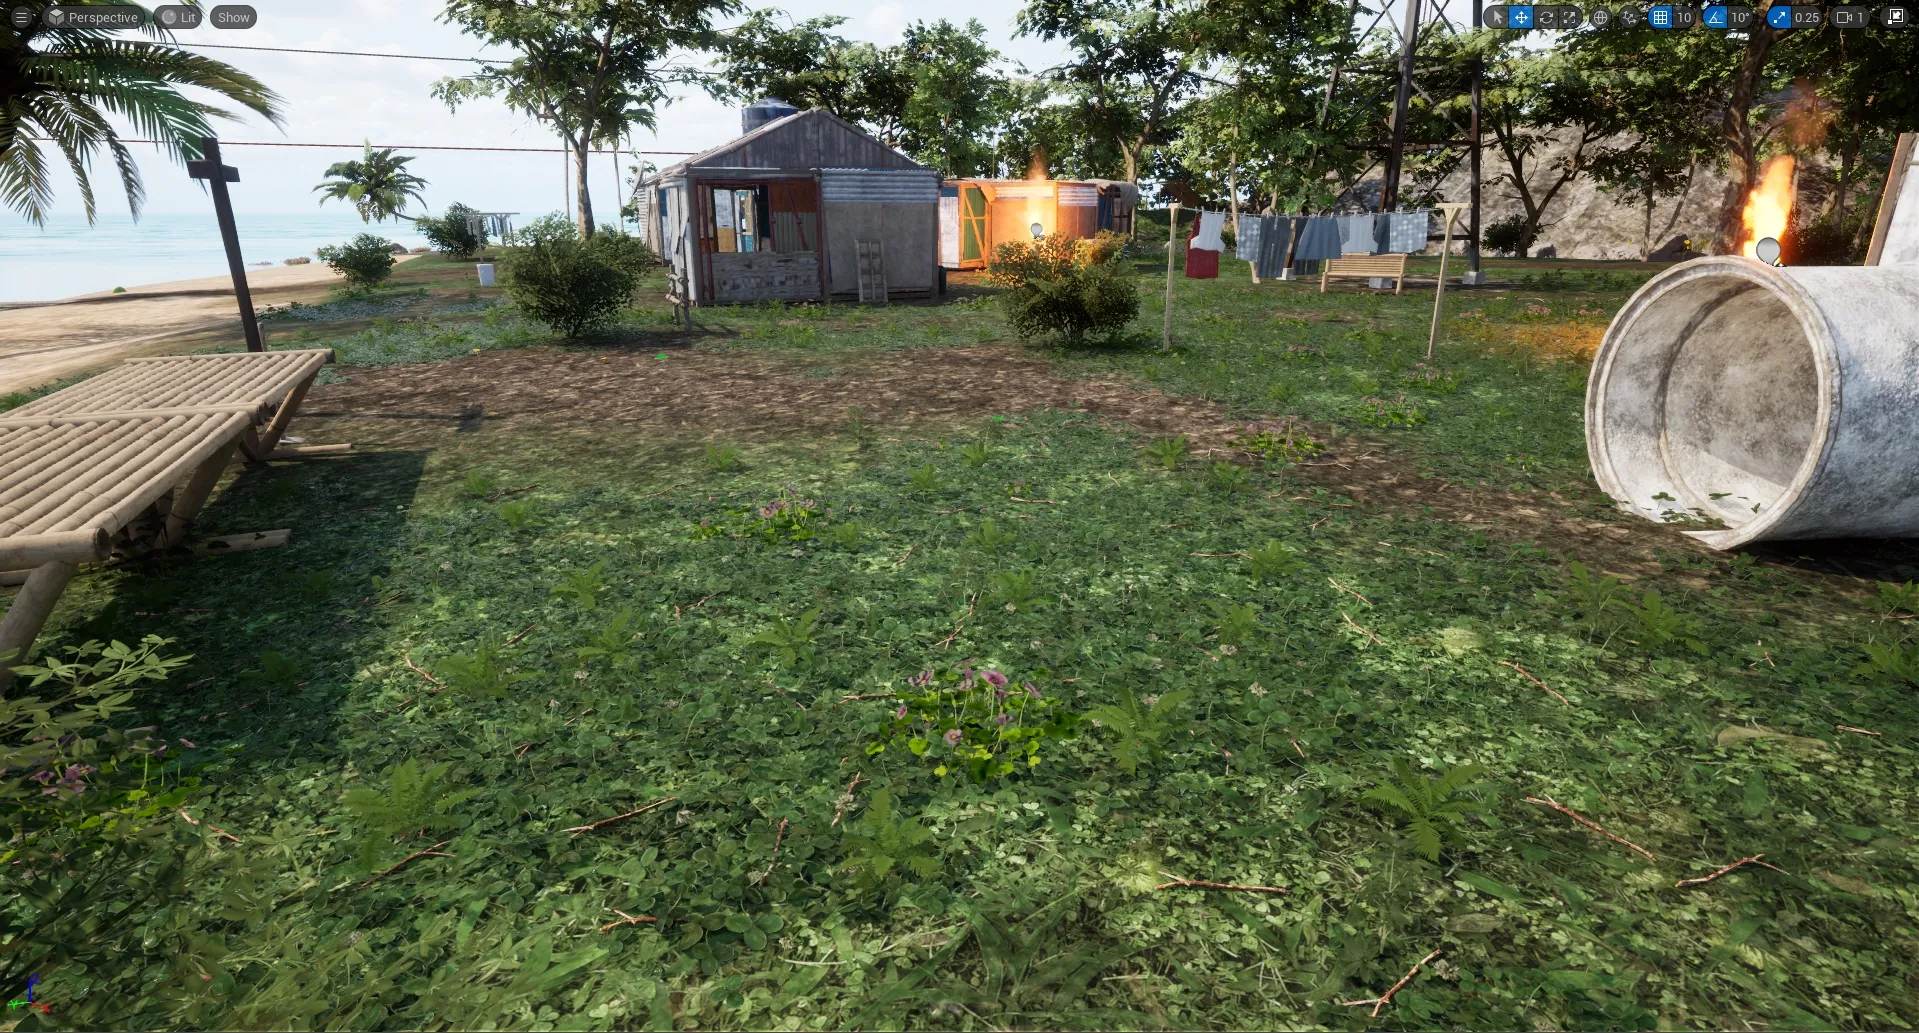
Comparison Before (with Dynamic Shadows ON) and After (with Contact Shadows ON) focusing on Grass
Also, our Torches were causing huge FPS loss when getting close to it, you can see almost 4ms was spent when looking directly to it.
And with the change of contact shadows, we could notice a huge performance gain (the Shadow Depths pass went from ±4.35ms to ±2.26ms), which frees a lot of GPU usage:

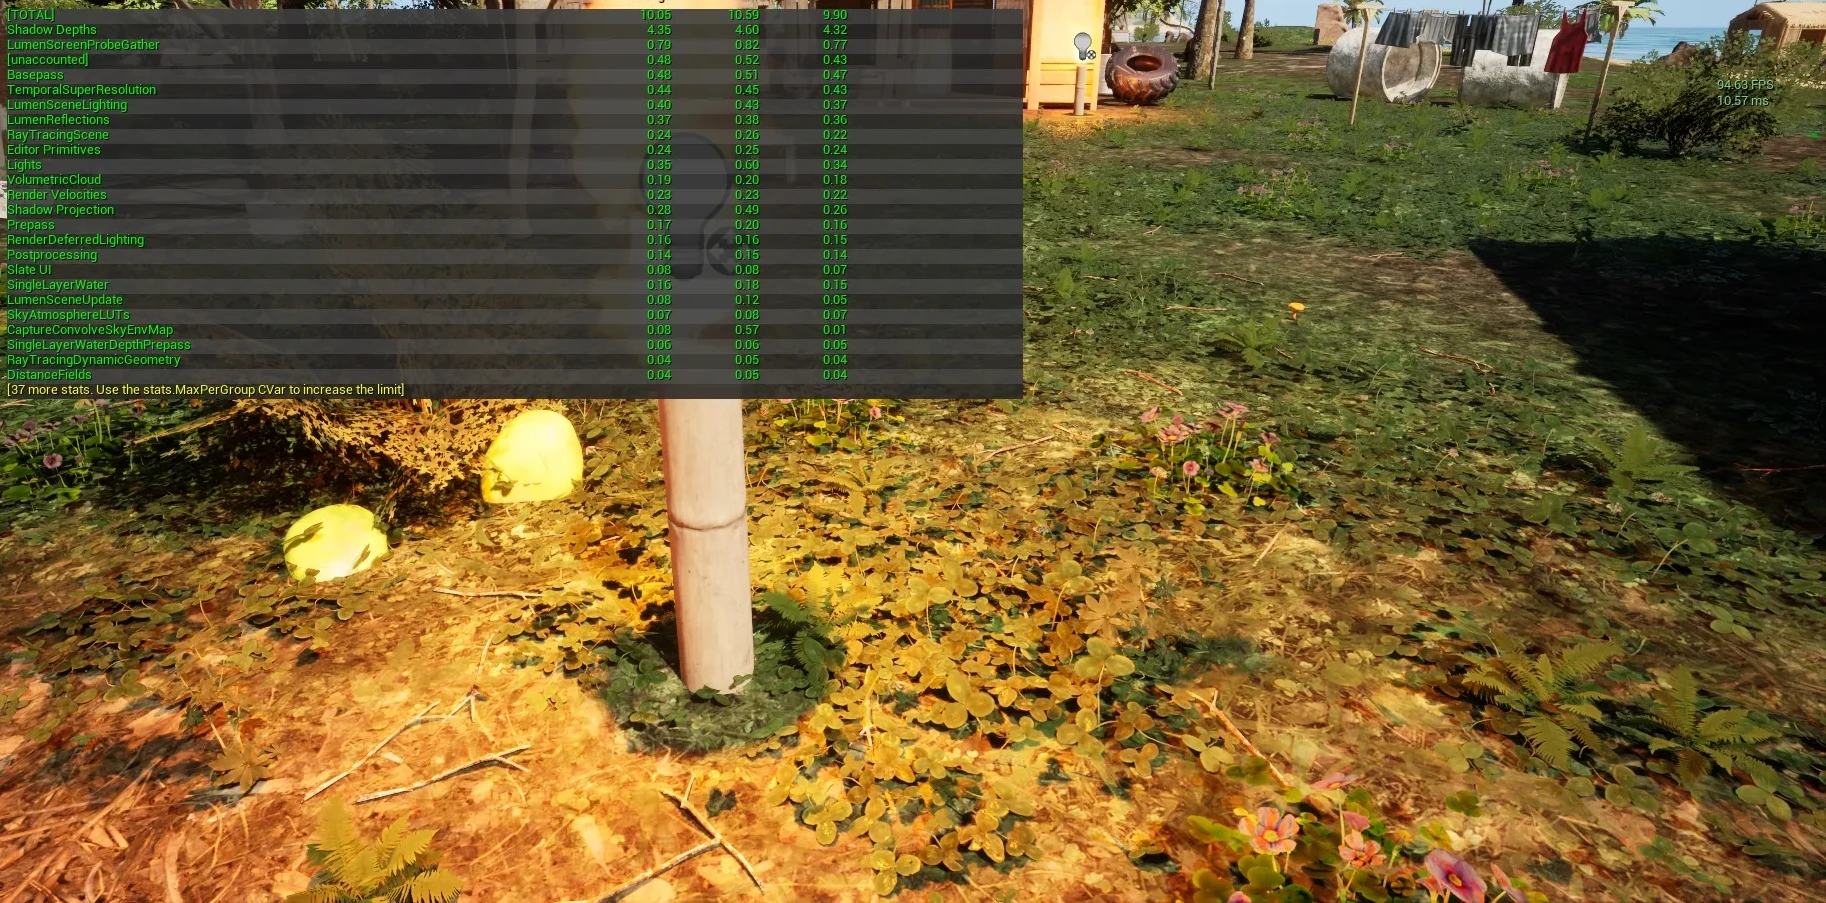
Performance Comparison when near the Torches
Actor Ticks
Also, I've found that in the game tick, there were a lot of actors and components ticking every frame, even though they were not being active or being used, and this was taking some considerable percentage of the main thread frame time.
Just to mention a few examples:
- Weapons had several Ticks enabled all the time, to calculate things like blood debounce or the firing cadence, and it has been improved by only activating them when we have the weapon picked up.
- Pawns (Character & CharacterSimple) had a bunch of components and other meshes active and ticking, such as Parachute or Physics Handles for non authority players, so now they are enabled/disabled on demand based on the need.
Among other small changes, the performance and optimization is way further improved now, allowing even more entities spawned at the same time.
Testing Map Improvs.
Other Testing Map improvements made:
Torches On/Off
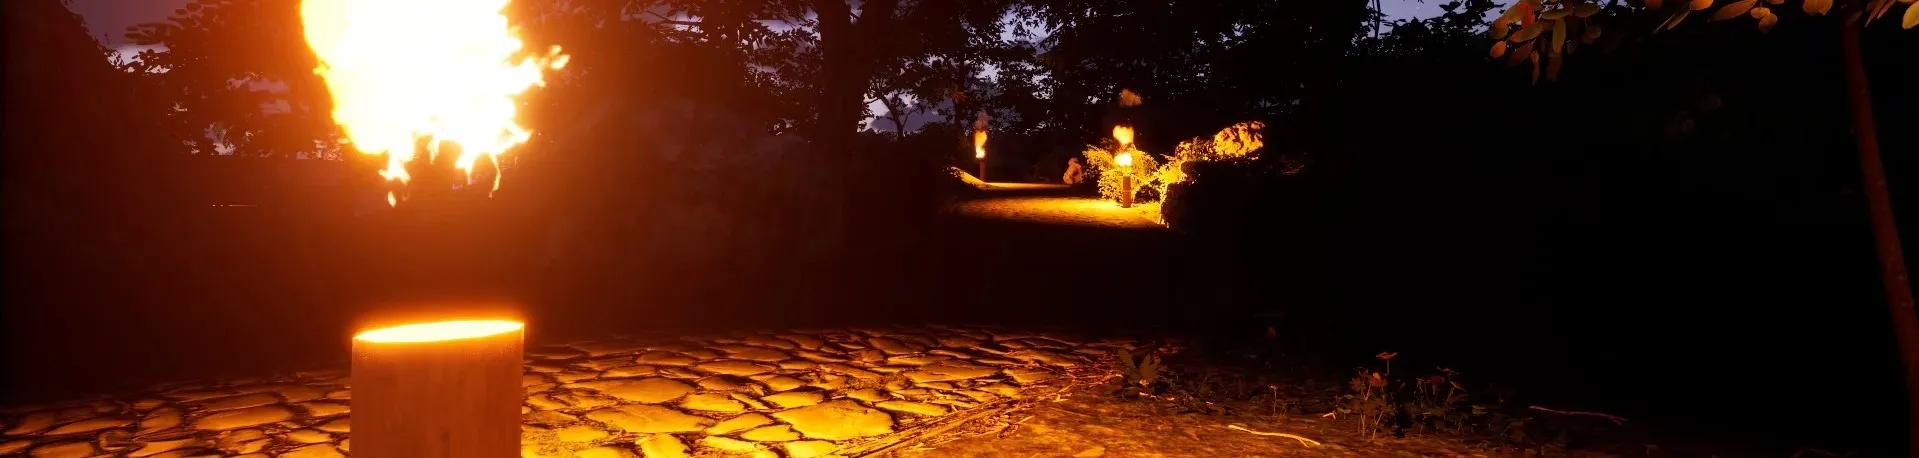
The old day/night Torches system was fixed, now it automatically switches ON/OFF based on the time of the day.
It works by hooking the Ultra Dynamic Sky's time to detect if it's day or night.
Ambiance Sound
The old Ambiance Sounds was also fixed and put in place again, automatically cycling the Day's and Night's sound based on the time of the day.
Reduced Trees
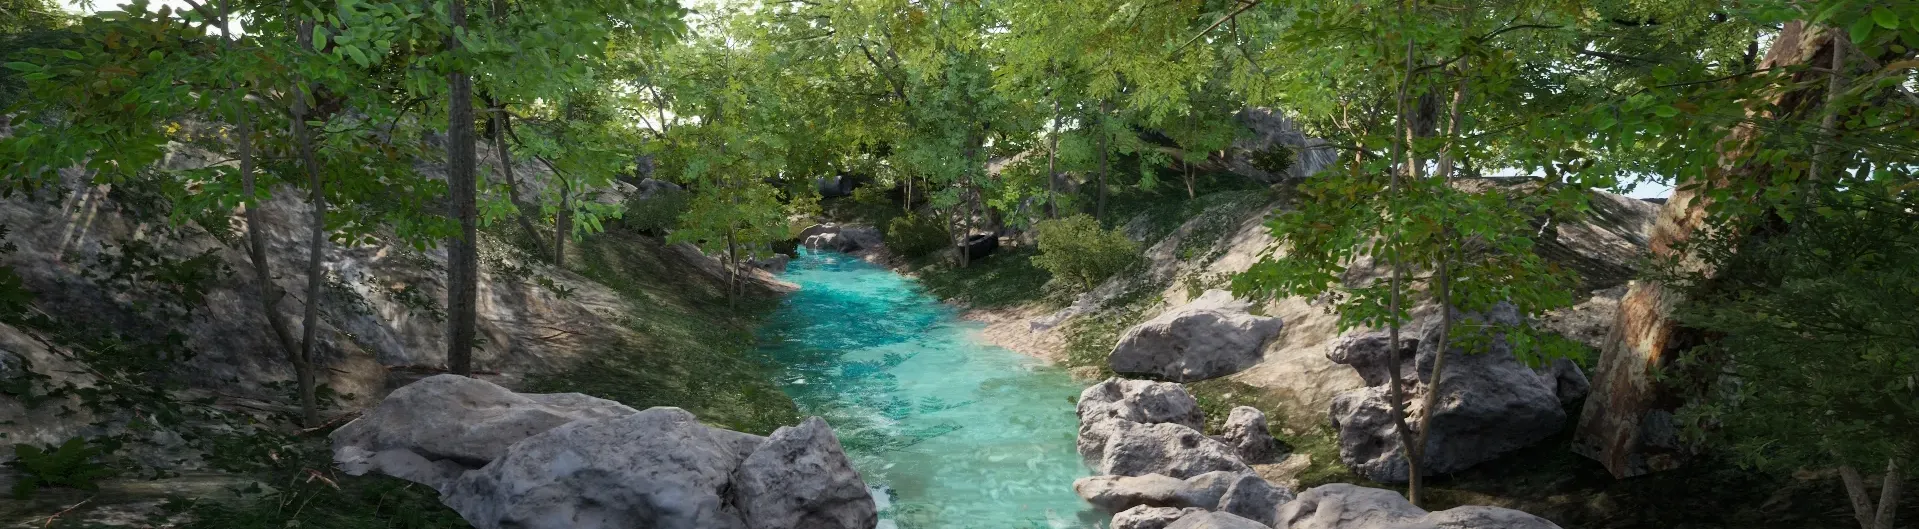
I've reduced the amount of trees the Testing Map had, as in some areas it was causing bad visual clarity and even negatively affecting the performance.
Minor Honorable Mentions
Some small improvements made:
Main Menu FPS
The Main Menu is now capped to your monitor's refresh rate (was previously capped at 120).
Unreal Updated 5.4.4
The Unreal version was updated to the latest patch version 5.4.4, no cooked asset should break in this update.
Conclusion
This month was a great advance for optimization lovers (like me), several low and high-level performance issues were tackled, not to mention the new DLSS features which adds another layer of optimization over everything.
A huge THANK YOU to everyone who contributed to reach our "Keep the Dev Awake Fund" Ko-fi's Goal ☕! Your absolutely rocked it! Your support keeps this project flourishing, and keeps me caffeinated too. 😅
Also, since Ko-fi donations accumulate over time, I've updated it to be a "monthly based" goal.
There's a lot cooking under the hood, and some big things are coming soon™! As always, thank you for being part of this journey! 💙
Until next time!